AI and BI System Liveboard
Use the AI and BI Stats System Liveboard in ThoughtSpot Cloud to monitor query usage and analyst activities across all Orgs. It joins Query Stats with Analyst Studio data to provide comprehensive visibility into product usage, adoption, and billable queries.
Metrics are directly tied to query logs, reducing ambiguity and ensuring precise reporting. Use this Liveboard to understand daily, weekly, monthly, quarterly, annual and total active query users, monthly objects volume and so on. You must have admin privileges to view this Liveboard.
Users with admin privileges can share system Liveboards, such as the AI and BI Stats Liveboard, with other users who do not have admin privileges. However, be aware that you may be sharing sensitive user-level information, such as the names of objects that a user accessed.
To view this Liveboard:
-
Go to the Admin tab.
-
Choose System Activities.
-
Select the AI and BI Stats, or search for AI and BI Stats.
Use the Liveboard
You can filter the Liveboard by user from the filter bar underneath the Liveboard name.
Use this Liveboard to view and analyze information about the following topics:
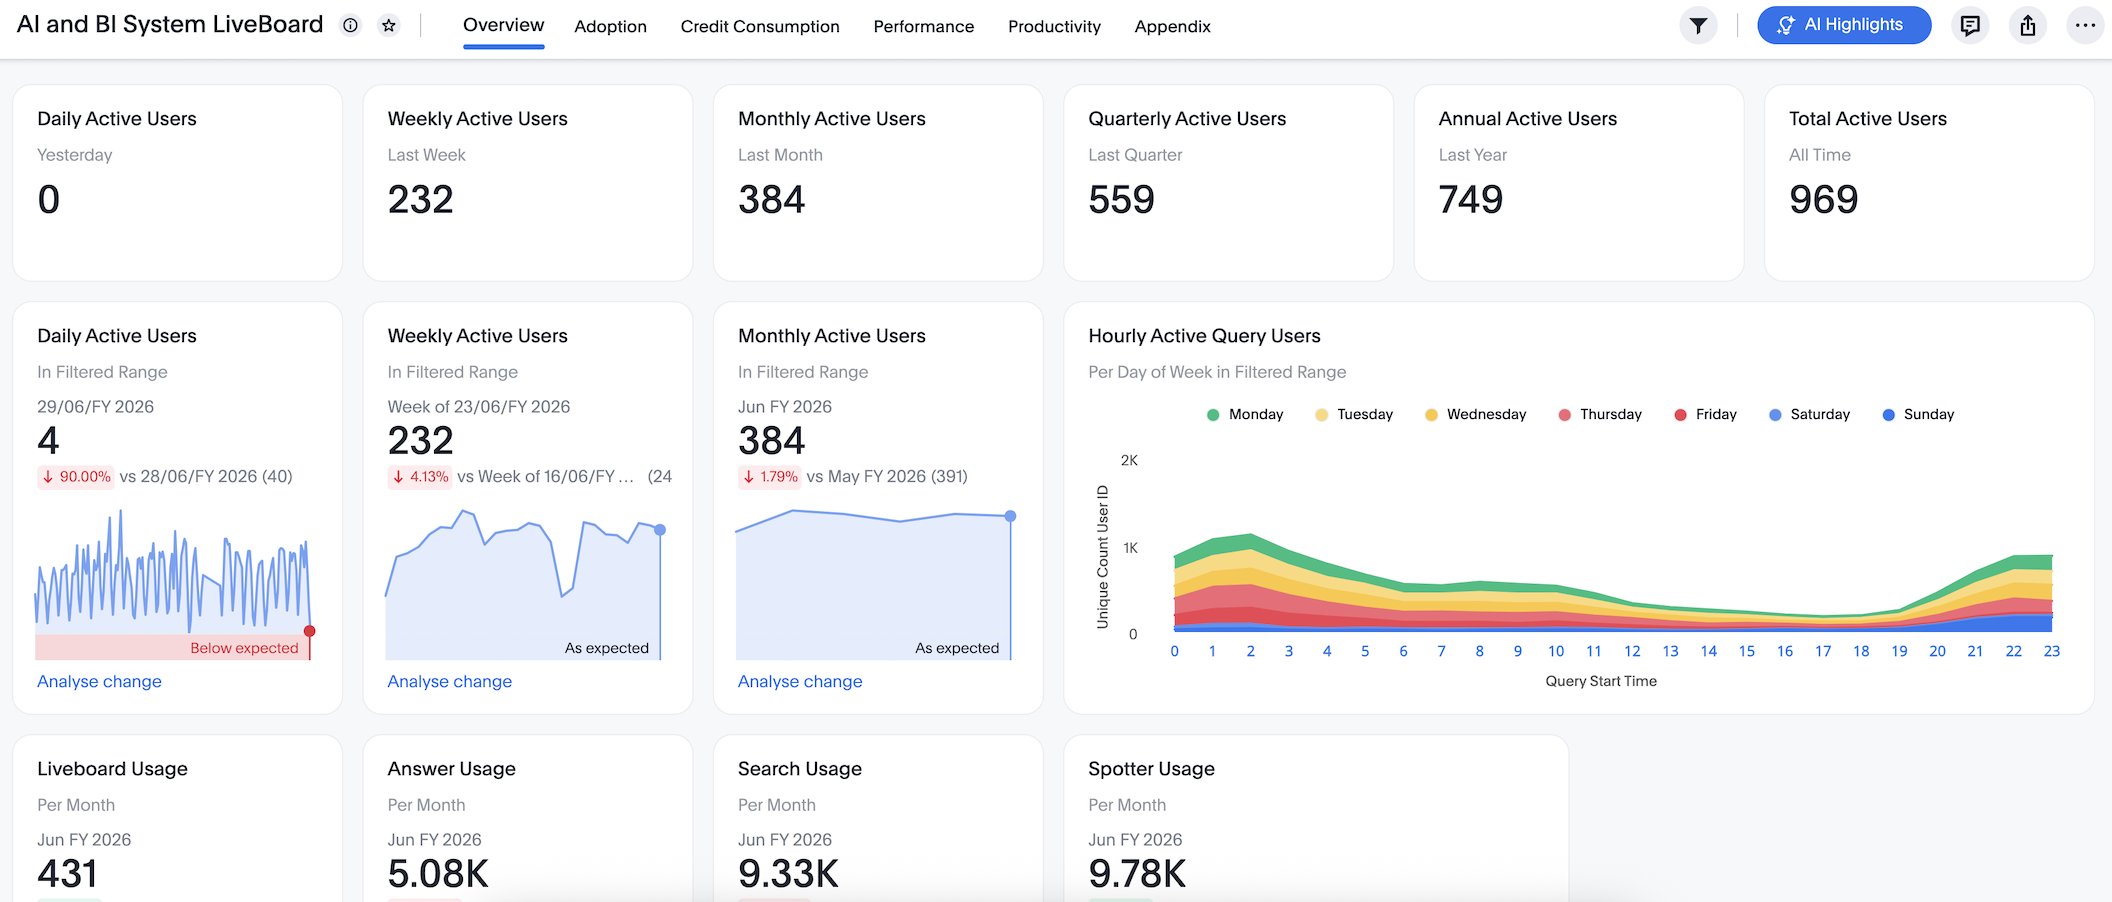
Overview
-
Daily, weekly, monthly, quarterly, annual and total active query users (Daily Active Query users, Weekly Active Query users, Monthly Active Query users, Quarterly Active Query users, Annual Active Query users, Total Active Query users)
Users are compared against the immediate preceding period, which means today vs. yesterday, this week vs. last week, this month vs. last month.
-
Daily Active Users, Weekly Active Users, Monthly Active Users in Filtered Range is a filtered range comparison of unique users on a Month-to-Date (MTD) basis.
-
Number of unique queries made in each hour of the day, for every day from Monday to Sunday in the most recent week (Hourly Active Query Users, Per Day of Week in Filtered Range)
-
Number of unique Liveboards used over the month (Liveboard Usage)
-
Number of unique Answers used over the month (Answer Usage)
-
Number of unique Searches used over the month (Search Usage)
-
Number of unique Spotter queries used over the month (Spotter Usage)
-
Top 20 Models, Liveboards and Answers at the time when the user is viewing the Liveboard (Top 20 Models, Top 20 Liveboards, Top 20 Answers)
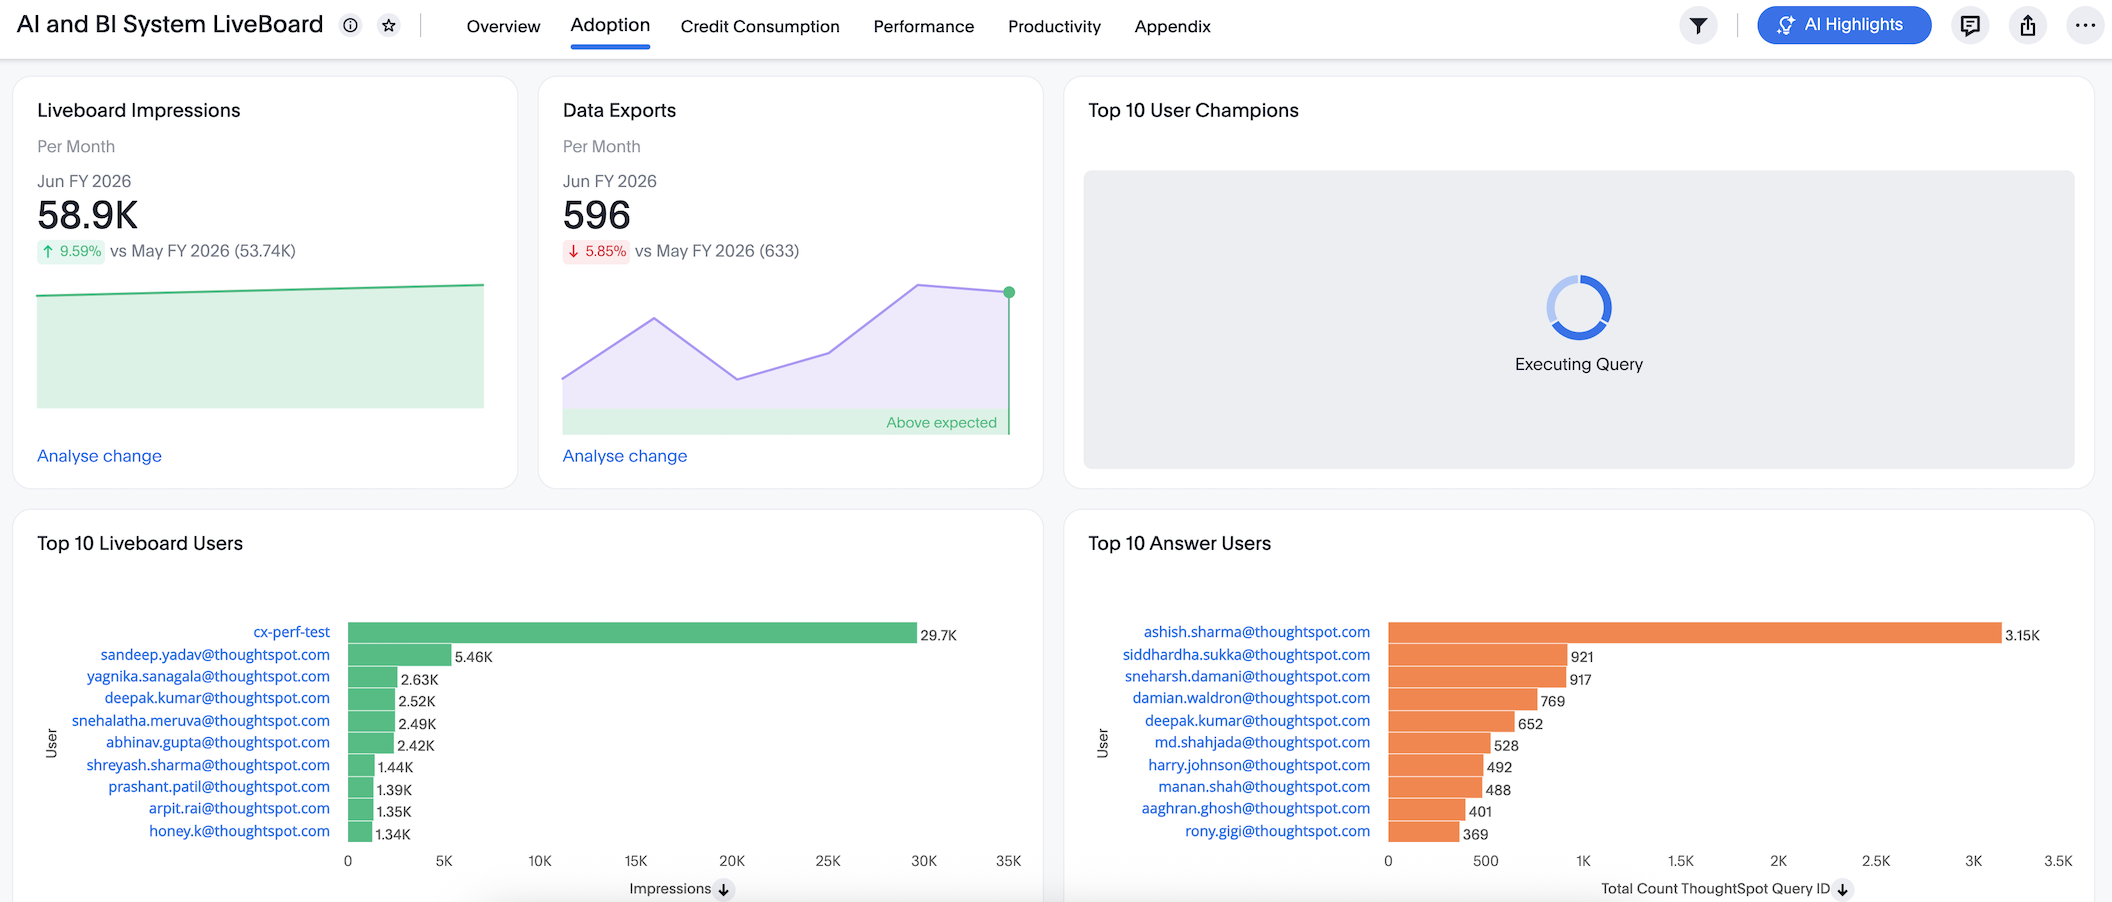
Adoption
-
Monthly unique Liveboard impressions (Liveboard Impressions)
-
Monthly users exporting data from the ThoughtSpot application (Data Exports)
-
ThoughtSpot users leaderboard (Top 10 User Champions)
-
Monthly Liveboard users leaderboard (Top 10 Liveboard Users)
-
Monthly Answer users leaderboard (Top 10 Answer Users)
-
Total Spotter users leaderboard (Top 10 Spotter Users)
-
Total Search users leaderboard (Top 10 Ad-hoc Search Users)
-
Users with the maximum daily activity across the ThoughtSpot application (Top 50 Power Use Engagement)
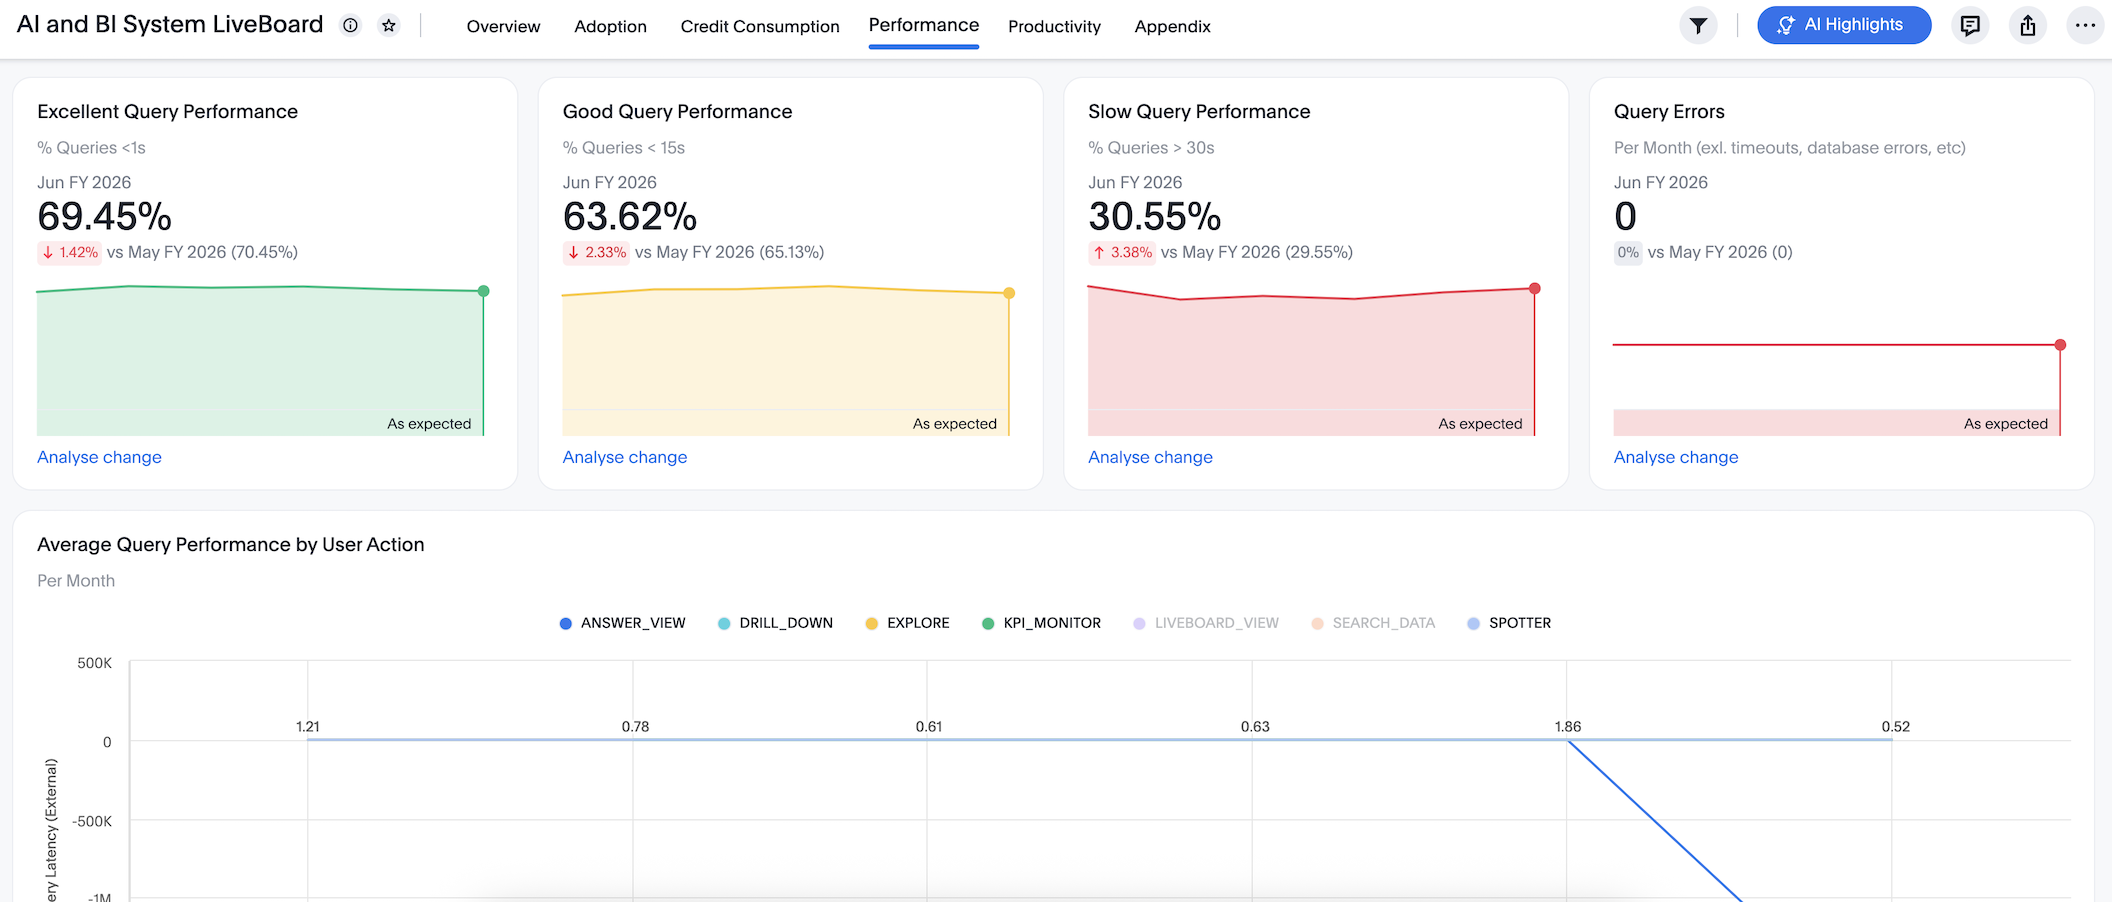
Performance
-
Queries executing in less than 1sec (Excellent Query Performance)
-
Queries executing in less than 15sec (Good Query Performance)
-
Queries taking more than 30sec to execute (Slow Query Performance)
-
Monthly query errors across the ThoughtSpot application (Query Errors)
-
Average external query latency for each user action on a monthly basis, with filters to exclude null values (Average Query Performance by User Action)
-
List of 50 slowest queries with query success status, time taken, latency experienced, and the query string (50 Slowest Search Data Queries)
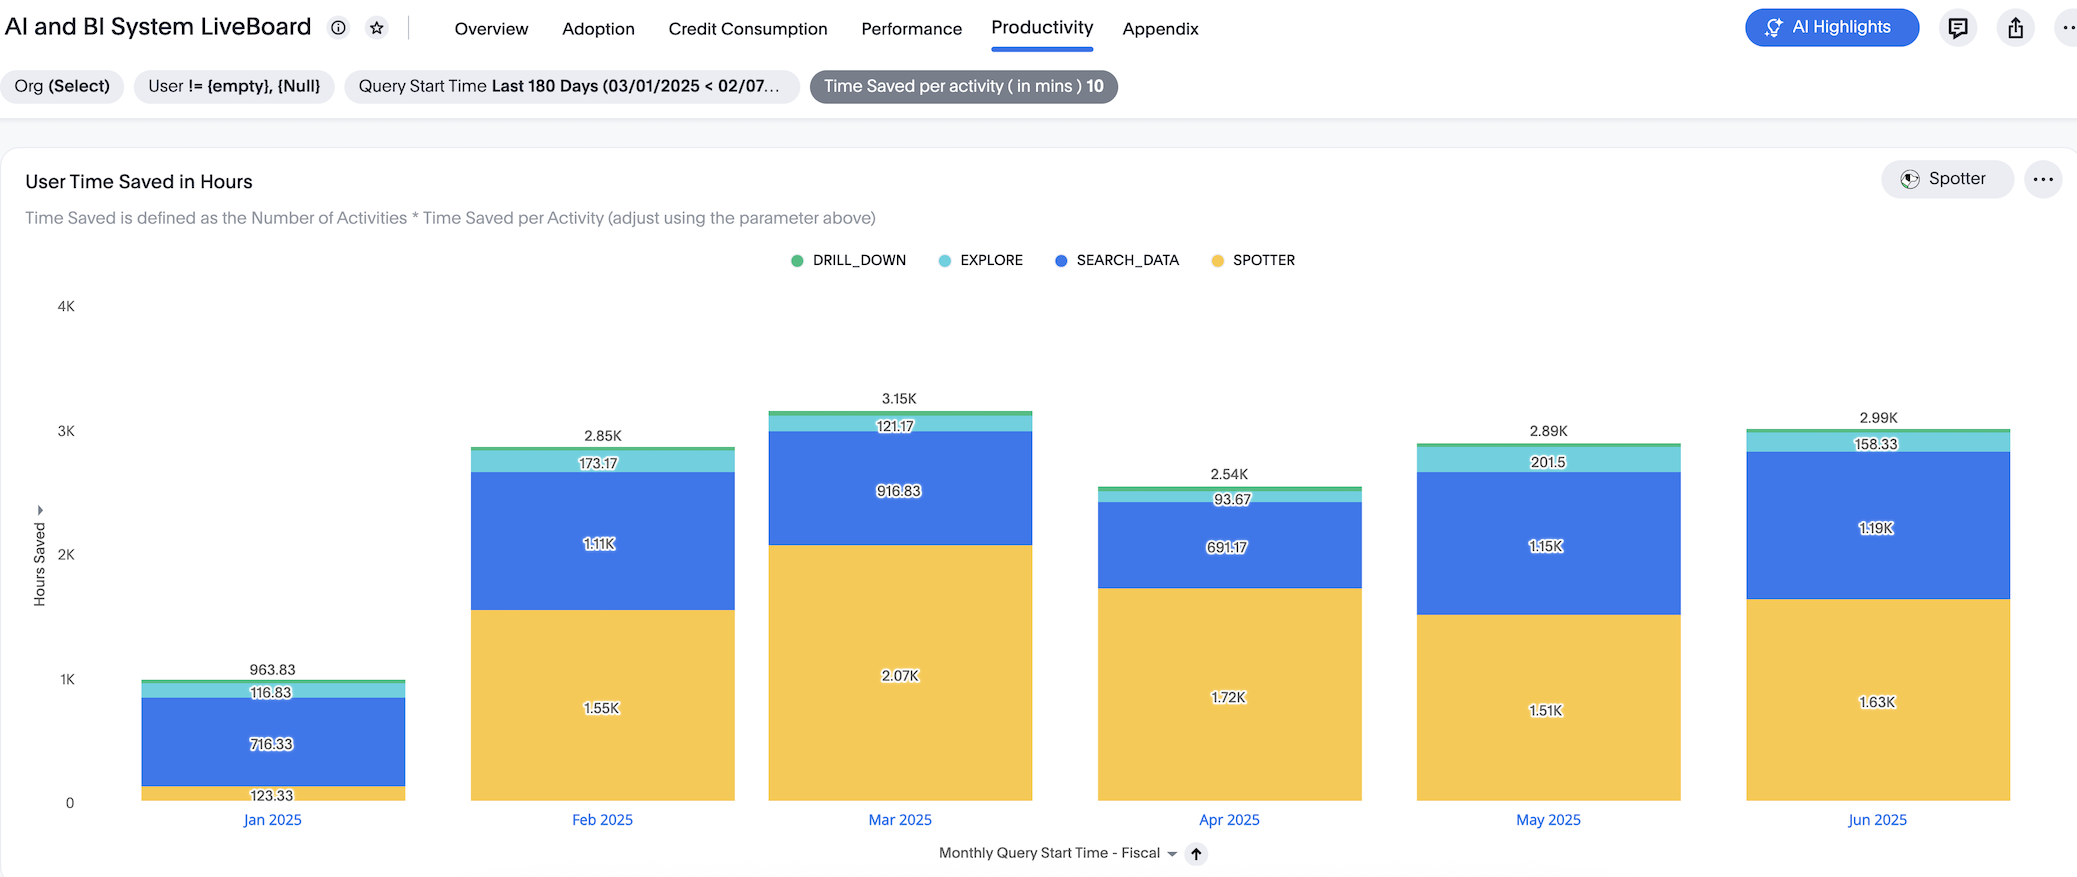
Productivity
-
Monthly time saved by users across activities such as Drill Down, Explore, Search data, and Spotter.
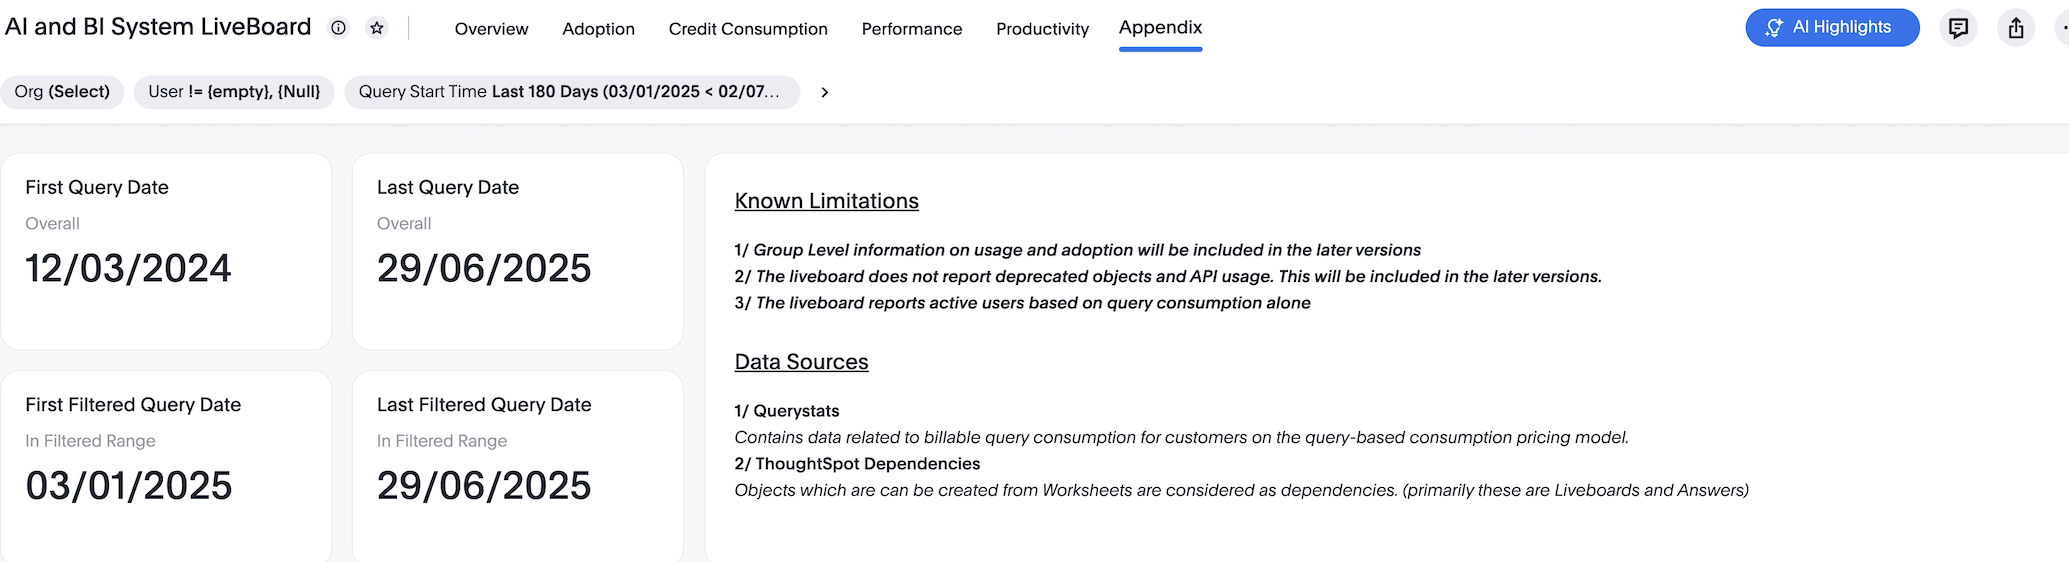
Appendix
-
First interaction date with the AI and BI Stats Liveboard (First Query Date)
-
Last interaction date with the AI and BI Stats Liveboard (Last Query Date)
-
The first date when an answer with a filtered range loads or a filter is manually applied (First Filtered Query Date)
-
The last date when an answer with a filtered range loads or a filter is manually applied (Last Filtered Query Date)
-
The known limitations for the AI and BI Stats Liveboard (Known Limitations)
-
The list of data sources evaluated to populate the results on the AI and BI Stats Liveboard (Data Sources)
Best practices
The AI and BI Stats Liveboard contains valuable information you can use to monitor and manage query consumption by the users. Follow these best practices when interacting with this Liveboard:
-
Share the AI and BI Stats Liveboard with other ThoughtSpot champions and executive buyers in your organization. To share the Liveboard, you must search for the Liveboard from the Liveboards page or from the Home page. You can’t share it from the Admin Console.
-
Consider creating a dedicated group for your data leaders or champions, so you can easily share insights, such as this Liveboard, that help your teams drive adoption.
-
-
Spot query consumption trends, such as the number and types of objects accessed over time
-
Understand Spotter usage and adoption
-
Improve latency time for users across the ThoughtSPot application by analysing the slow performing queries and other health markers