SpotIQ analysis
Everywhere in ThoughtSpot where you can run SpotIQ analyze, you can configure a customized SpotIQ analysis. The customized analysis can be a one-time customization or can apply to all future analysis of that particular data source.
Finding customization controls
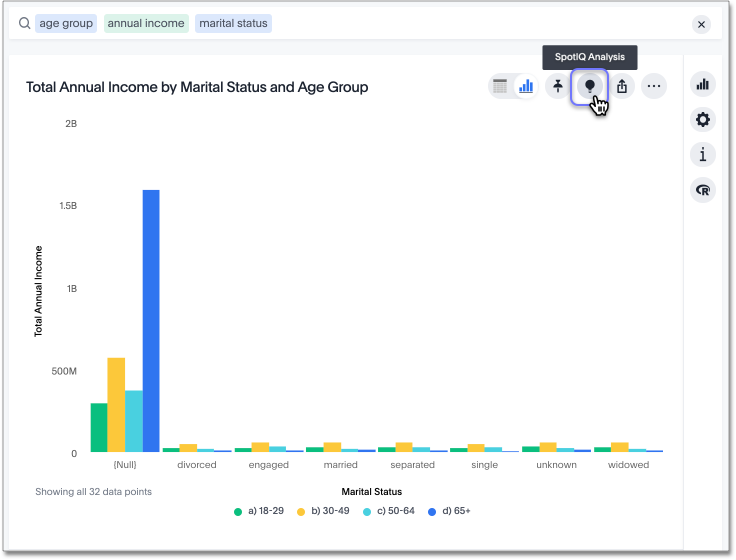
Every menu or location where you can run SpotIQ analyze, you can customize your analysis.
You access it using the light bulb button ![]() or the more options menu
or the more options menu ![]() .
.
SpotIQ window workflow
-
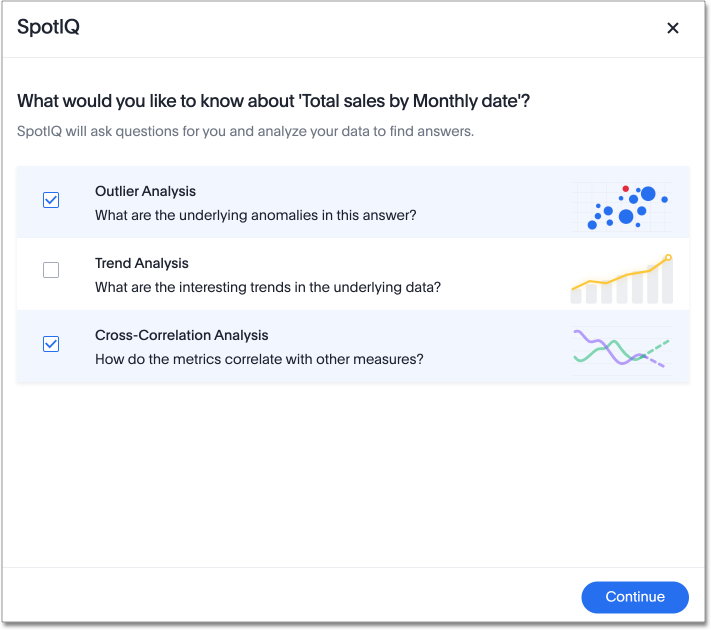
The SpotIQ analysis window first asks you what kind of analysis you would like to do:
-
Outlier analysis: finds underlying anomalies or outliers
-
Trend analysis: finds interesting trends in the underlying data
-
Cross-correlation analysis: determines how your metrics correlate with other measures
-
Change analysis: if you select 2 or more data points, you can run a change analysis on those points. Otherwise, ThoughtSpot does not show you this option.
If you enable Forecasting, SpotIQ only allows you to run one kind of analysis at a time. If you disable Forecasting, you will be able to multi-select.
-
-
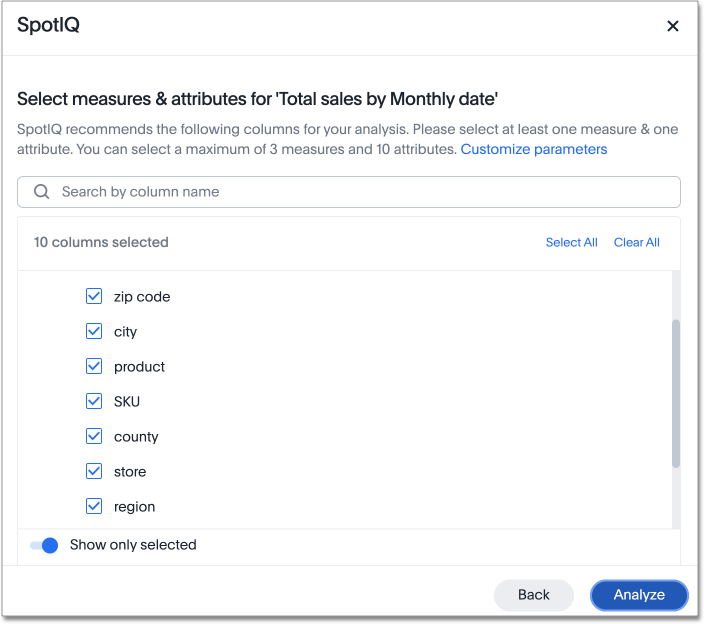
Next, SpotIQ recommends certain columns for analysis. You can select all columns in the Answer, clear all columns, or search for more columns to include.
-
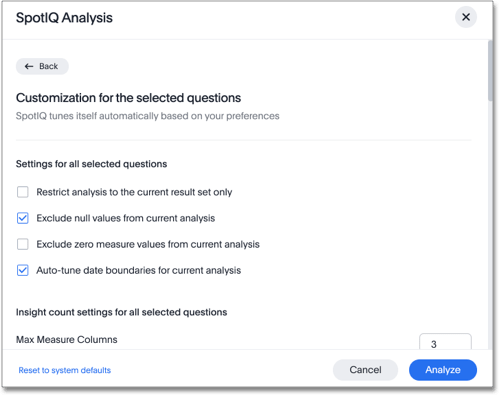
You can also customize advanced parameters. Select Customize parameters, on the Select measures and attributes page. The following screen appears. Scroll down to see more options, including customizations for specific analysis types.
You can customize the following parameters for any SpotIQ analysis except a change analysis:
-
General settings: exclude null values, restrict analysis to the current result set only, exclude zero values, or auto-tune date boundaries
-
Insight count settings: choose the maximum number of measure and attribute columns to analyze
You can customize the following parameters for an outlier analysis:
-
Outlier algorithm: choose the method of outlier detection (z-scores or median z-scores, Seasonal Hybrid ESD, or Linear Regression)
-
Outlier parameters: choose the minimum rows required for analysis, multiplier for outlier detection, and maximum P-Value
-
Insight count settings: choose the maximum outlier detection insights, maximum seasonality detection insights, and maximum linear regression insights
You can customize the following parameters for a trend analysis:
-
Trend parameters: specify the minimum rows required for analysis, maximum P-Value, and minimum relative difference
-
Insight count settings: specify the maximum trend insights
You can customize the following parameters for a cross-correlation analysis:
-
Cross-correlation parameters: choose the minimum rows required for analysis, minimum correlation coefficient, maximum correlation coefficient, and maximum correlation lag
-
Insight count settings: choose the maximum cross-correlation insights
You can customize the following parameters for a change analysis:
-
Change analysis parameters: specify the maximum difference elements, the maximum fraction, minimum abs change ratio, and minimum change ratio
You can also reset these parameters to their system defaults. Select Reset to system default in the lower-left corner of the SpotIQ modal.
-
-
Select Analyze.
Related information