Set the y-axis range
You can manually set the y-axis range by selecting edit from the y-axis label dropdown menu, or from the chart configuration menu.
Setting the y-axis range from the axis label
To set the y-axis range:
-
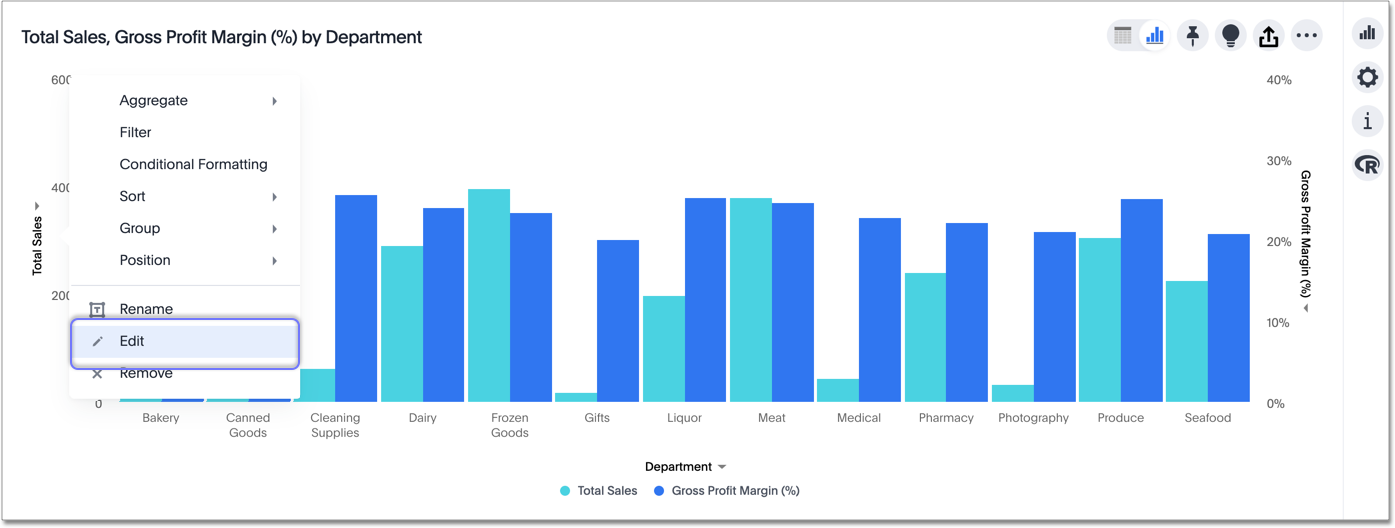
While viewing your Answer as a chart, open the dropdown menu icon
 next to the y-axis label you want to change.
 -
Select edit.
-
Under Min and Max, set the y-axis range by specifying start and end values.
In this example, the original chart shows sales values by department from 0 to over $5M. We can enter a y-axis range of
2500000to5000000to show only sales between $2.5M and $5M.The chart reorganizes itself to reflect the new y-axis range.
To change the range for gross profit margin, open the dropdown menu icon next to the gross profit margin axis label.
Setting the y-axis range from the chart configuration menu
To set the y-axis range:
-
While viewing your Answer as a chart, select the chart configuration icon
 on the upper right.
 -
Select the edit button
 that appears when you hover over y-axis.
 -
If you have multiple measures on the y-axis, select the measure you want to set the range for.
-
Under Min and Max, set the y-axis range by specifying start and end values.
In this example, the original chart shows sales values by department from 0 to over $5M. We can enter a y-axis range of
2500000to5000000to show only sales between $2.5M and $5M.The chart reorganizes itself to reflect the new y-axis range.
