Spotter best practices
Understand Spotter’s capabilities
What questions can Spotter answer today?
Spotter is a versatile AI analyst that helps users interact with their data. Spotter can help the users with the following types of questions:
- Data insights – Answers data questions
-
You can ask data literacy-related questions to get a better understanding of the data and what’s present in the data set. You can also ask Spotter to answer data questions which can be answered by querying the data warehouse.
- Change analysis – Answers why questions
-
You can ask "why" questions on any Answer. The system breaks down the question into three sub-questions based on the top three attributes relevant to the analysis. Spotter then analyzes the top contributors for each attribute value and reports the findings.
- Deep analysis - Analyze complex questions
-
You can ask complex questions to Spotter and your question is broken down to sub-questions to help Spotter better understand. This feature is particularly useful for analyzing key performance indicators (KPIs) and their trends.
Spotter user interface
Let’s take a look at the Spotter user interface to understand how users can use the various options available. Spotter is designed as a conversational experience. The image below highlights some of the key elements:
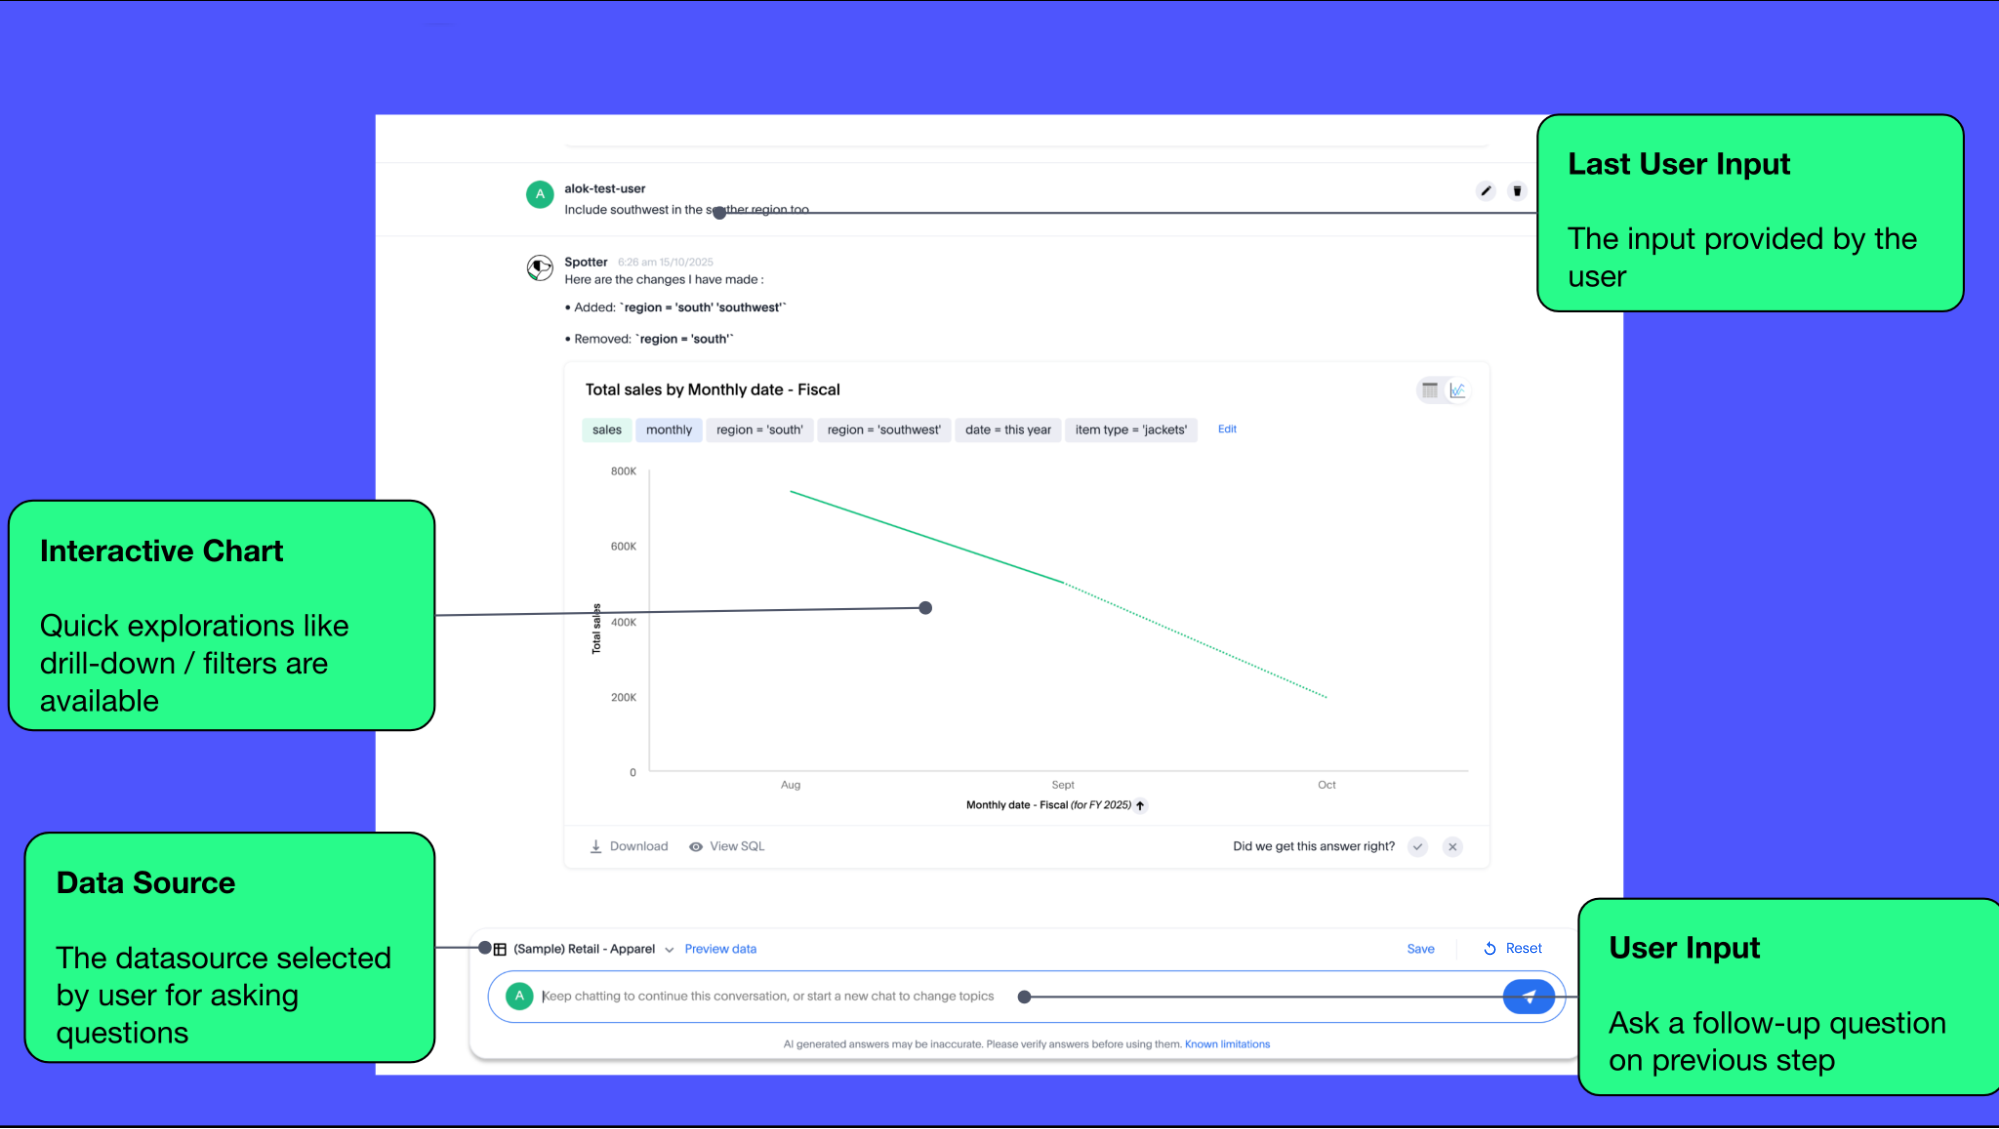
- User Input
-
The user input area is available at the bottom of the screen. You can use this to ask questions to the AI analyst or provide instructions on how the AI analyst should modify the answer.
All follow-up questions in Spotter are treated as a follow-up to the last question. If you want to start with a new question, we recommend using the Reset option to reset the conversation. - Last User Input
-
Shows how your historical questions are displayed in the conversation.
- Interactive Chart
-
Interactive chart is one of the elements of the response generated by Spotter. You can interact with the chart (similar to other parts of the ThoughtSpot product).
Only the last answer in the conversation supports interactive charts. - Data Source
-
Shows the data source used for the conversation. You can change the data source from here if you want to start conversations on a different data source.
Spotter conversations started from a Liveboard do not allow changing the data source.
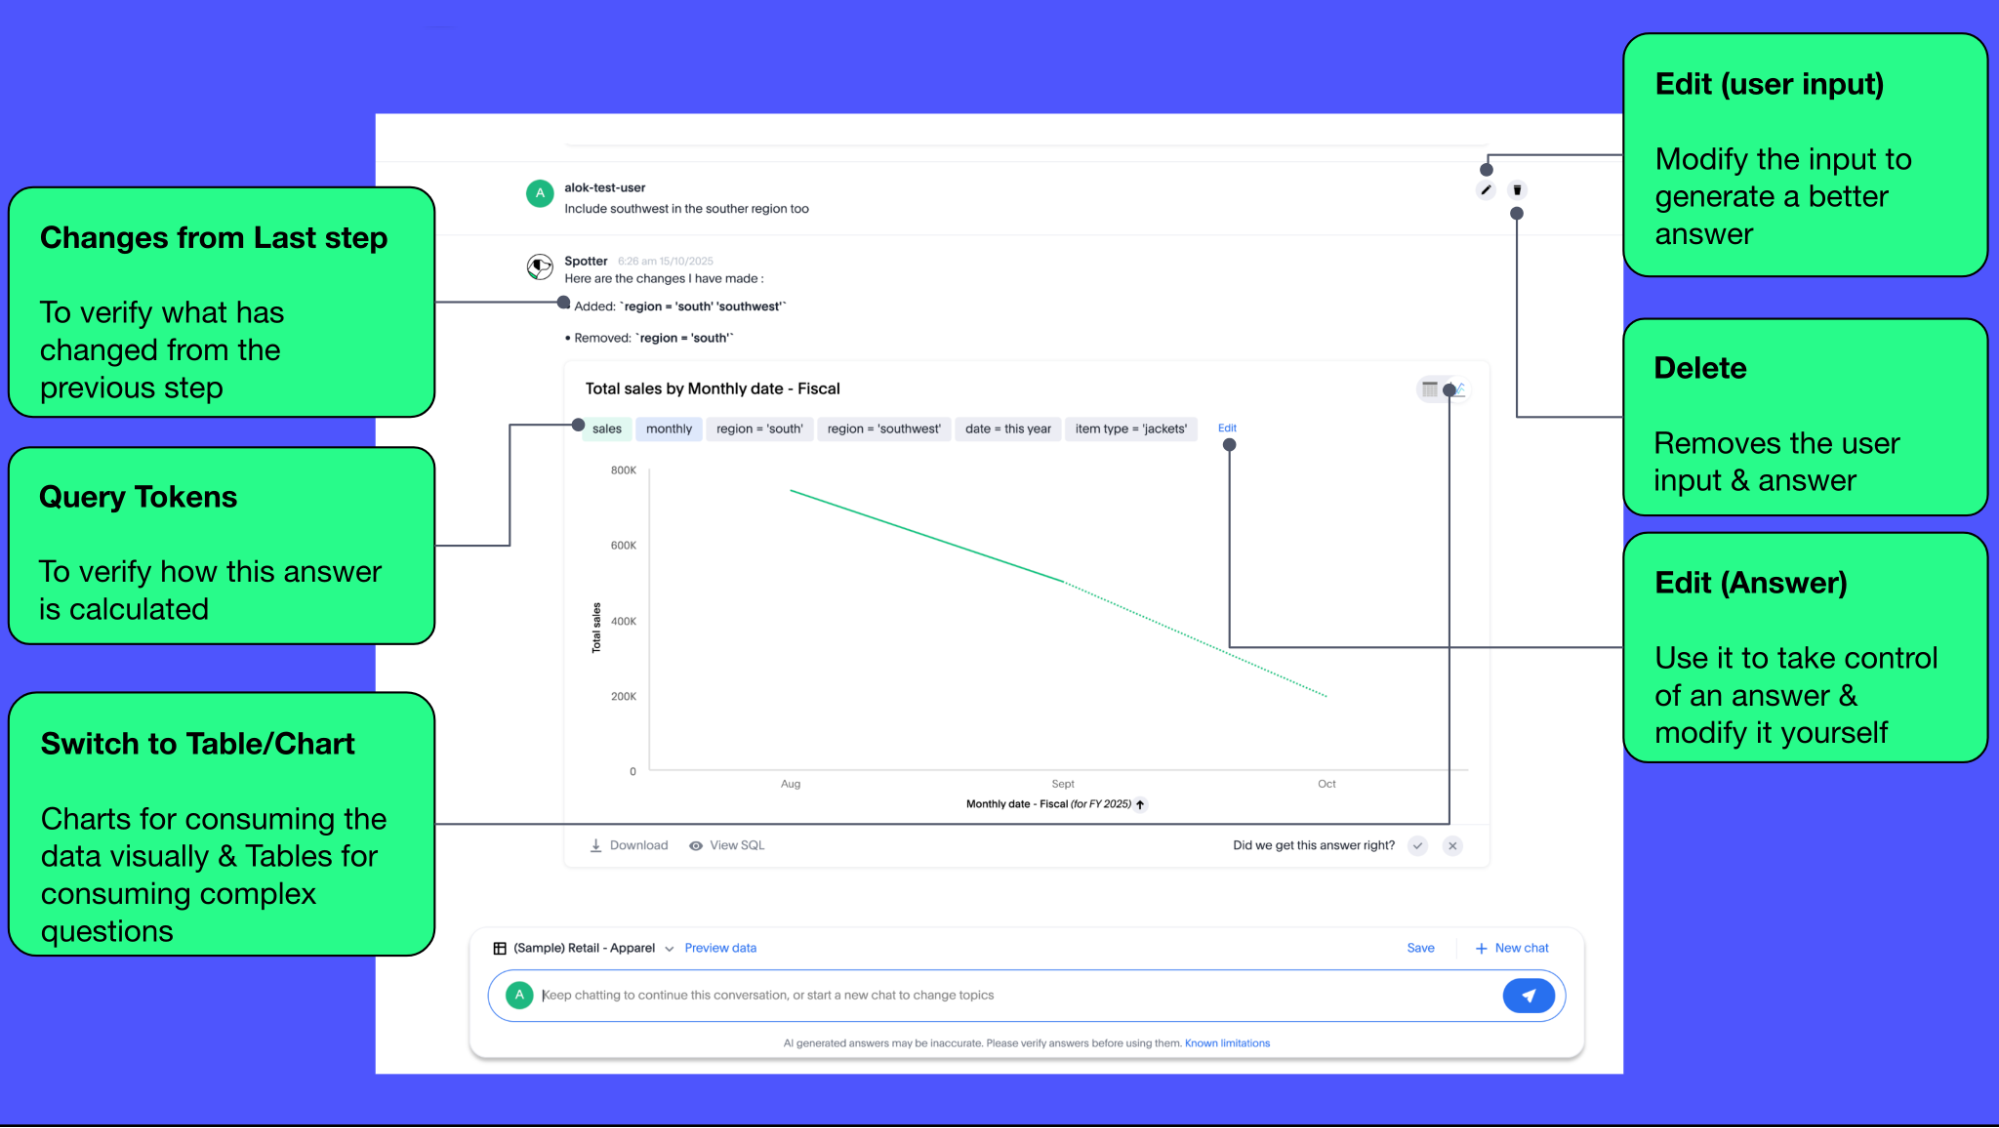
- Changes from Last Step (verification)
-
Whenever you ask a follow-up question in the conversation, Spotter’s response includes the changes made from the last step to help you verify what has changed from the previous step.
The changes from Last Step are not currently available in saved chats.
- Query Tokens (verification)
-
All answers in Spotter show query tokens. These query tokens represent the simplified query and they uniquely specify how the data shown in the answer was computed. You can use the query tokens at any step to verify the complete answer.
You can now hover over query tokens to see the following:
- Attributes
-
Spotter displays a description in natural language and sample values. Select More details to view column statistics (such as how many unique values exist), data type, and source.
- Measures
-
Spotter displays a description in natural language. Select More details to view column statistics (such as minimum and maximum values), data type, and source.
- Formulas
-
Spotter displays the formula used.
- Filters
-
Spotter displays an explanation of the filter in natural language and a mention of which value is being filtered.
- Switch Table/Chart (verification)
-
You can choose to view any answer in table view or chart view. The chart views are helpful for consuming simple answers while the table view is useful when the number of columns in the generated answer cannot be visualized elegantly in any chart.
- Edit user input (correction)
-
You can use the edit user input option to make modifications to your last question and make it more precise. Editing the latest user input will generate a new response using the edited instructions.
The option to edit user input is only available on the last question you asked. - Delete (correction)
-
Generating insights sometimes requires a fair bit of exploration of the data. You can remove follow-up questions in case you want to go back to a previous state in the conversation and deep-dive in a different direction.
The option to edit user input is only available on the last question asked. Once the user input is deleted, the answer associated with it is also deleted. - Edit Answer (correction)
-
You can take control and modify the answer or visualization settings using our keyword-based search interface. It’s useful when you want to explore the data set in Do it yourself mode. You can always make modifications to an answer and come back to the conversation to ask more questions on the modified answers.
The option to edit the answer is only available on the last question asked by the user.
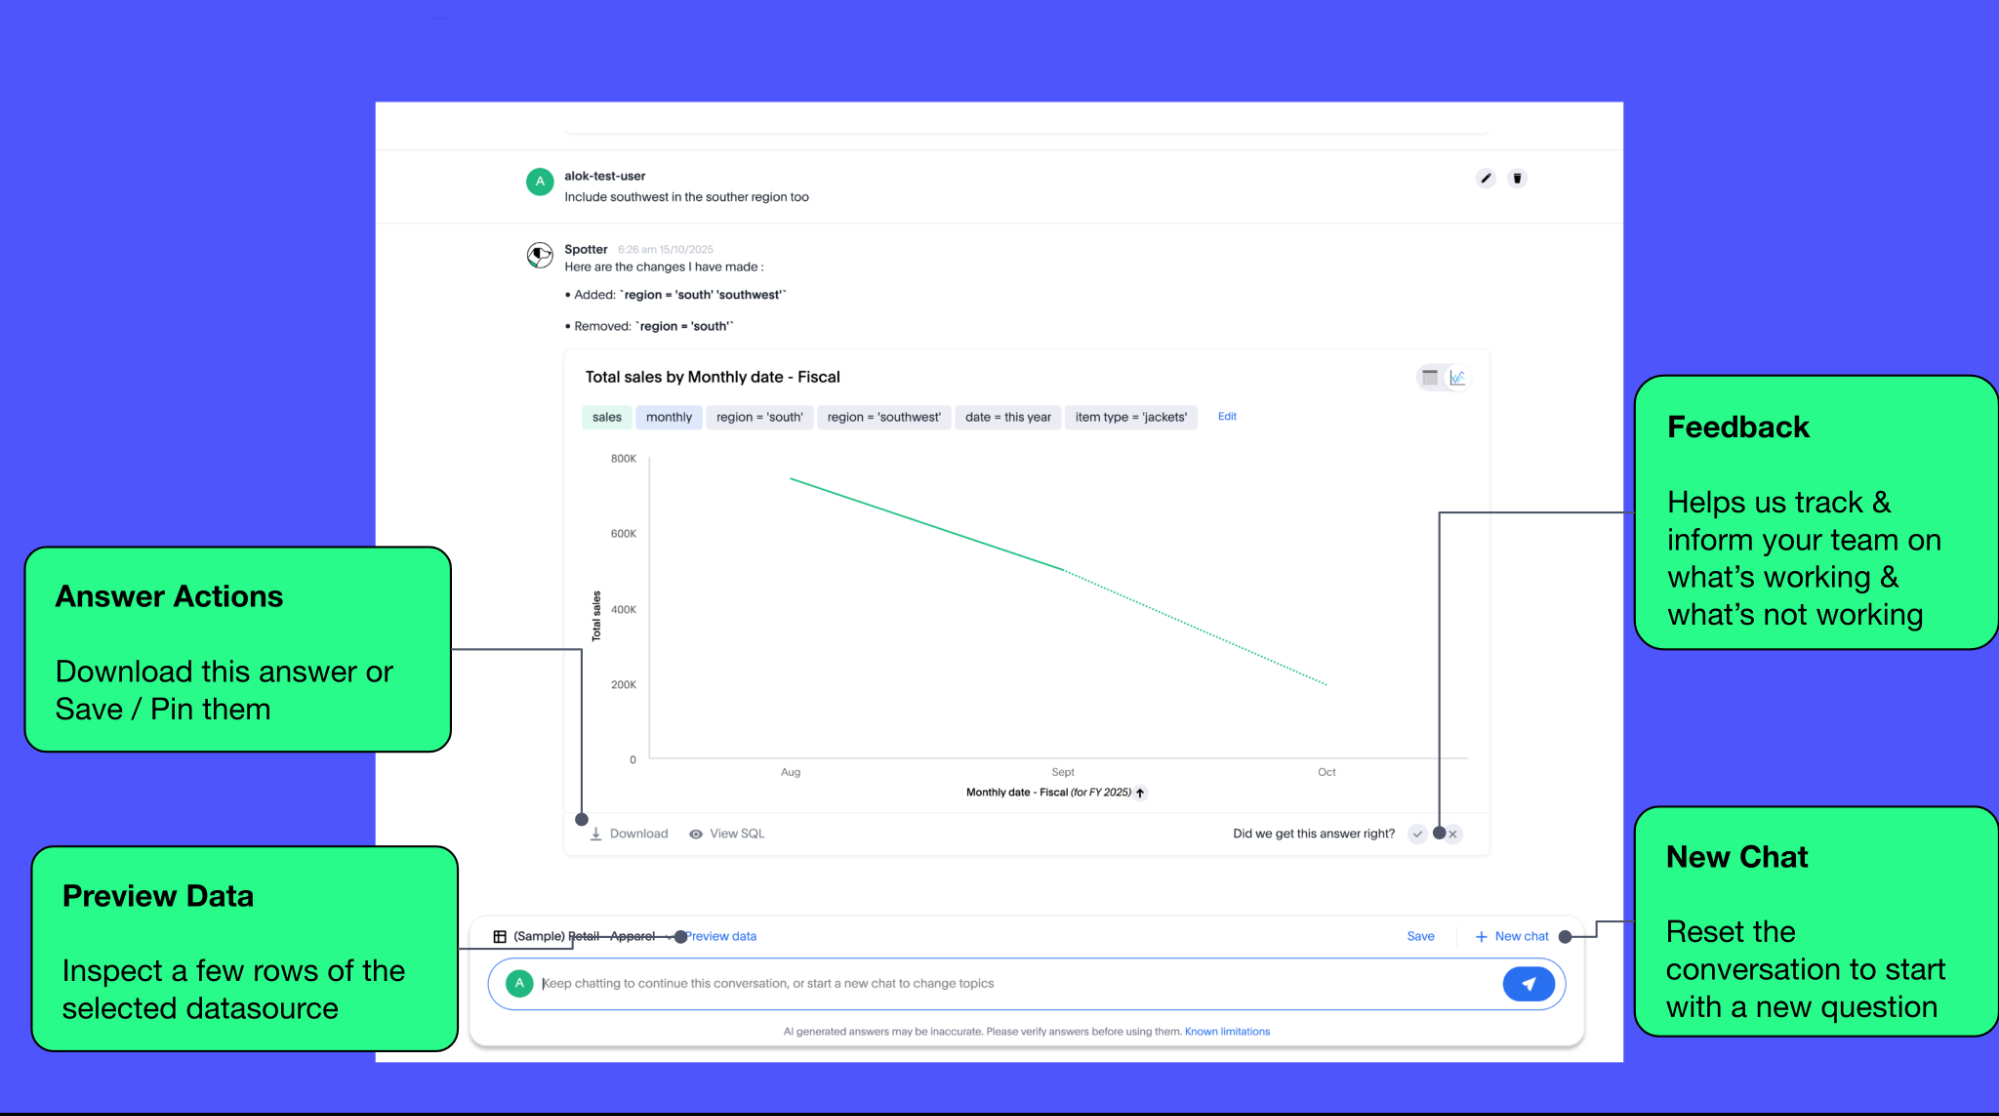
- Answer Actions
-
You can download the answer generated during the conversation. You can also save or pin the answer from the conversation when using Spotter in Cloud.
- Preview Data
-
Preview data shows a few rows from the data source to help you check what columns are available for analysis in the selected data source. Preview Data is currently unavailable for data sources which contain a chasm trap.
- New chat / Reset chat
-
All questions in the conversational experience are treated as a follow-up to the previous answer. If you want to start a new analysis with a fresh question, use this option to start a new conversation.
Spotter on Liveboards only provides the option to reset chat. When the chart is reset, you go back to the initial visualization from which the conversation started. - Feedback
-
Use the feedback option to inform us and your analytics team about which questions are not working.