AI and BI Stats Liveboard
Use the AI and BI Stats Liveboard to record user actions based on query consumption. You must have admin privileges to view this Liveboard.
This Liveboard contains essential information about your ThoughtSpot users and their adoption of the ThoughtSpot features. Metrics are directly tied to query logs, reducing ambiguity and ensuring precise reporting. Use this Liveboard to understand daily, weekly, monthly, quarterly, annual and total active query users, monthly objects volume and so on.
| If your organization uses multi-tenancy with Orgs, you must be a cluster administrator to view the AI and BI Stats Liveboard, not an Org administrator. |
Users with admin privileges can share system Liveboards, such as the AI and BI Stats Liveboard, with other users who do not have admin privileges. However, be aware that you may be sharing sensitive user-level information, such as the names of objects that a user accessed.
To view this Liveboard:
-
Go to the Liveboards tab.
-
Choose All.
-
Enter
System Userin the search field and then select AI and BI Stats, or search for AI and BI Stats.
Use the Liveboard
You can filter the Liveboard by user from the filter bar underneath the Liveboard name.
Use this Liveboard to view and analyze information about the following topics:
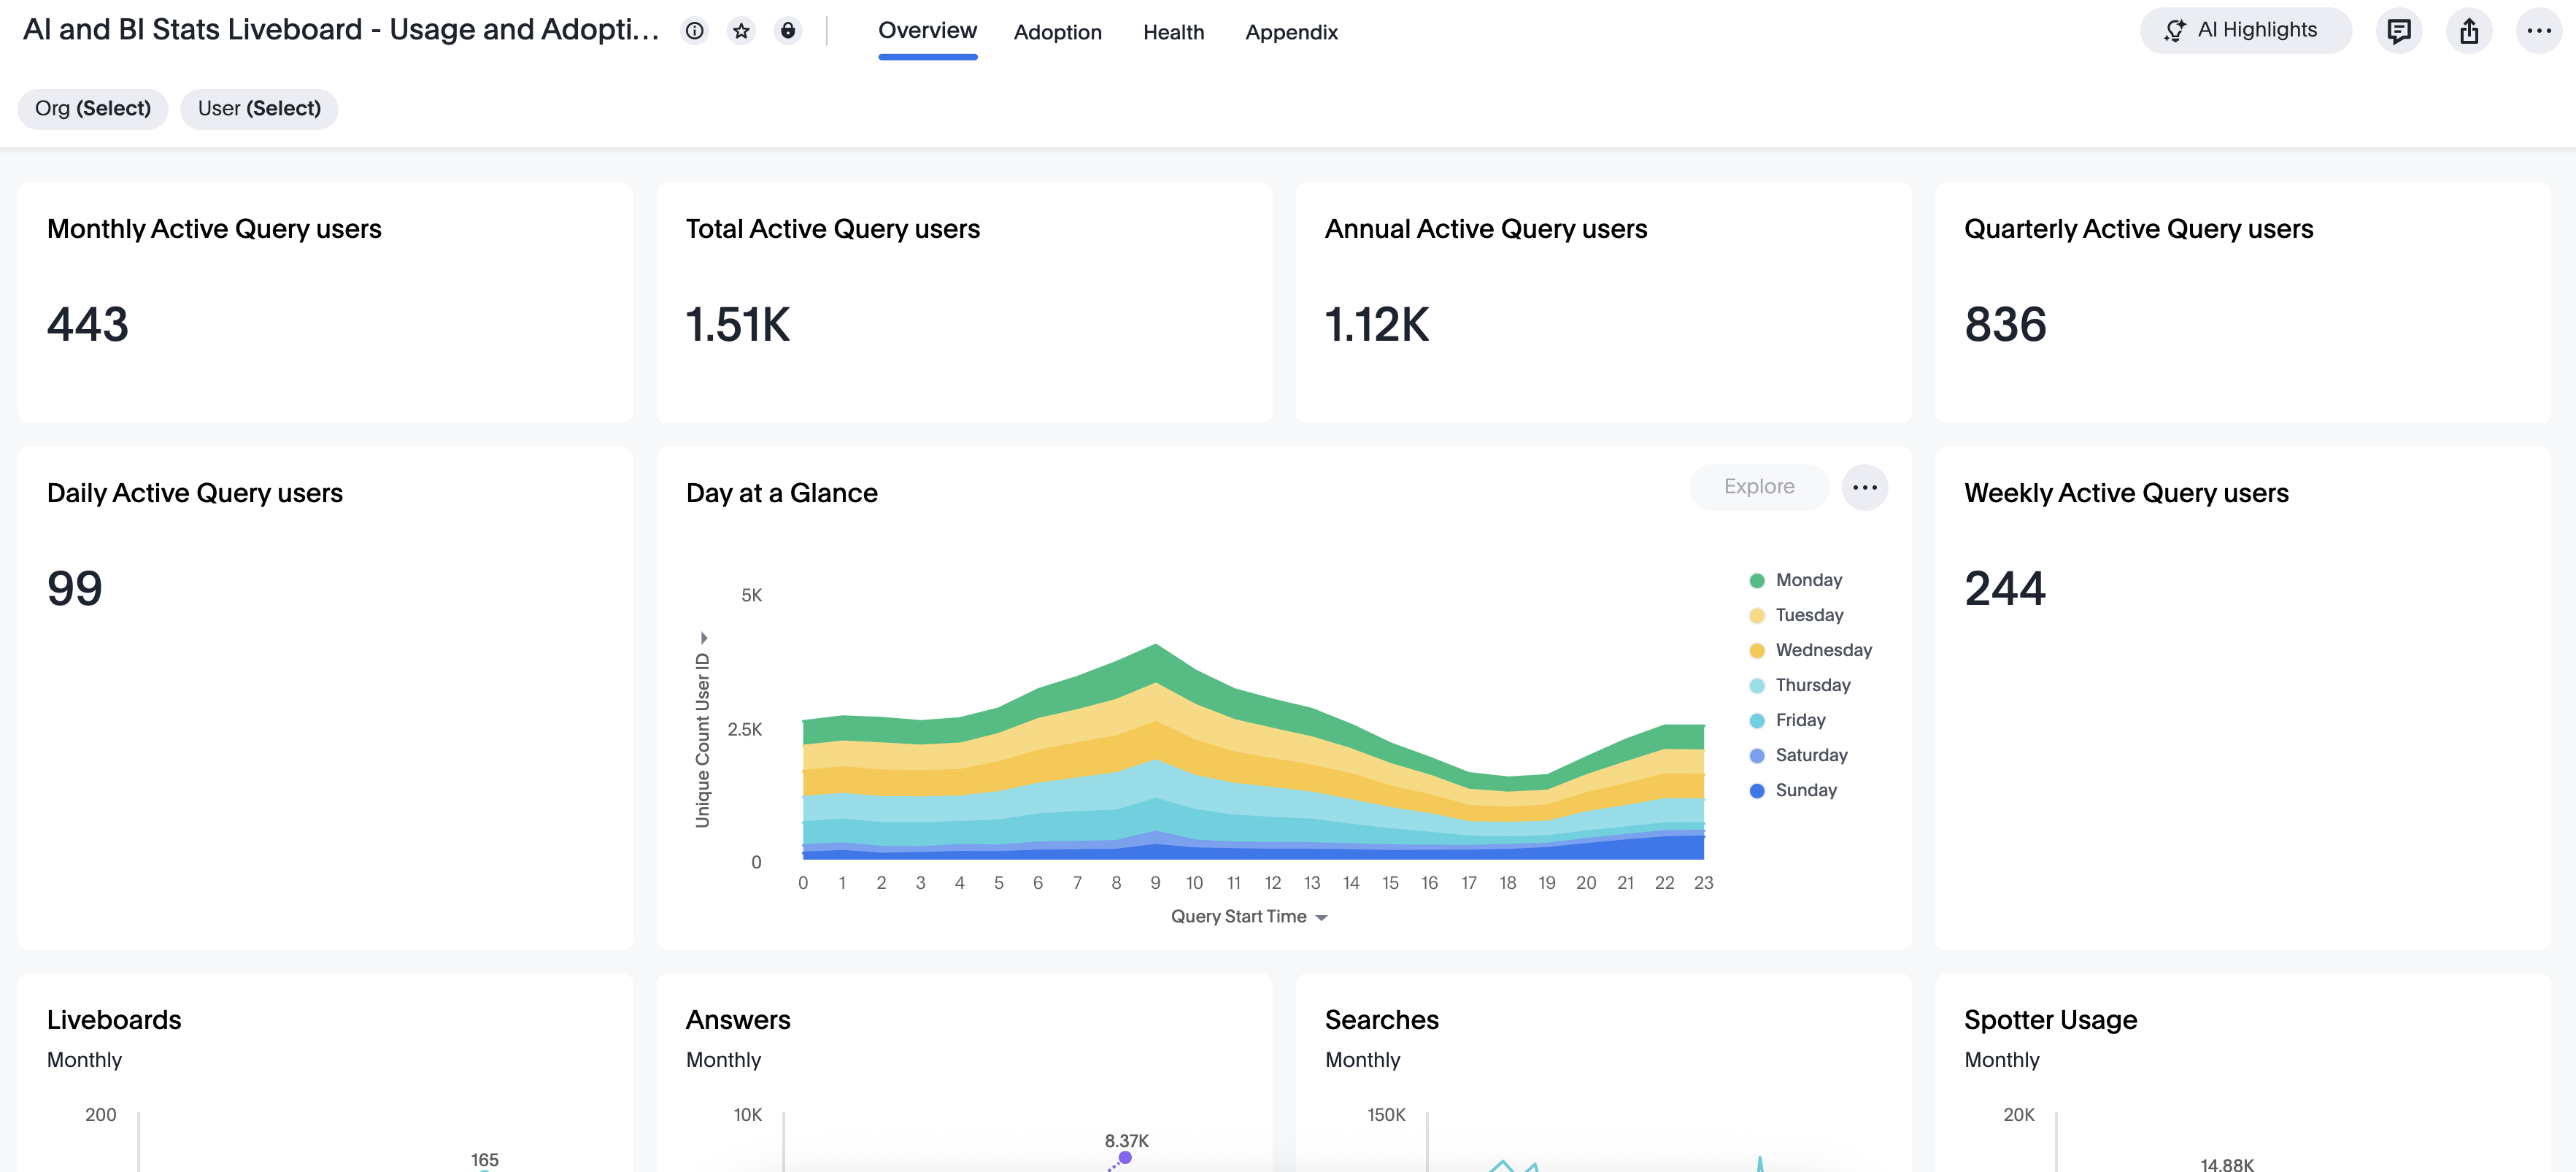
Overview
-
daily, weekly, monthly, quarterly, annual and total active query users (Daily Active Query users, Weekly Active Query users, Monthly Active Query users, Quarterly Active Query users, Annual Active Query users, Total Active Query users)
-
number of active users on a particular day (Day at a Glance)
-
number of unique Liveboards used over the month (Liveboards)
-
number of unique Answers used over the month (Answers)
-
number of unique Searches used over the month (Searches)
-
number of unique Spotter queries used over the month (Spotter)
-
top 50 worksheets, Answers and Liveboards (Monthly Worksheet Volume, Monthly Answer Volume, Monthly Liveboard Objects Volume)
Adoption
-
monthly unique Liveboard impressions (Liveboard Impressions)
-
ThoughtSpot users leaderboard (TS Leaderboard)
-
monthly Liveboard users leaderboard (Top 10 Liveboard users)
-
total Search users leaderboard (Top 10 ad-hoc search users)
-
total Spotter users leaderboard (Top 10 Spotter users)
-
monthly users exporting data from the ThoughtSpot application (Data Exports)
-
users having the maximum daily activity across the ThoughtSpot application (Top 50 Power Use Engagement)
-
------------ (Time Saved (Hours))
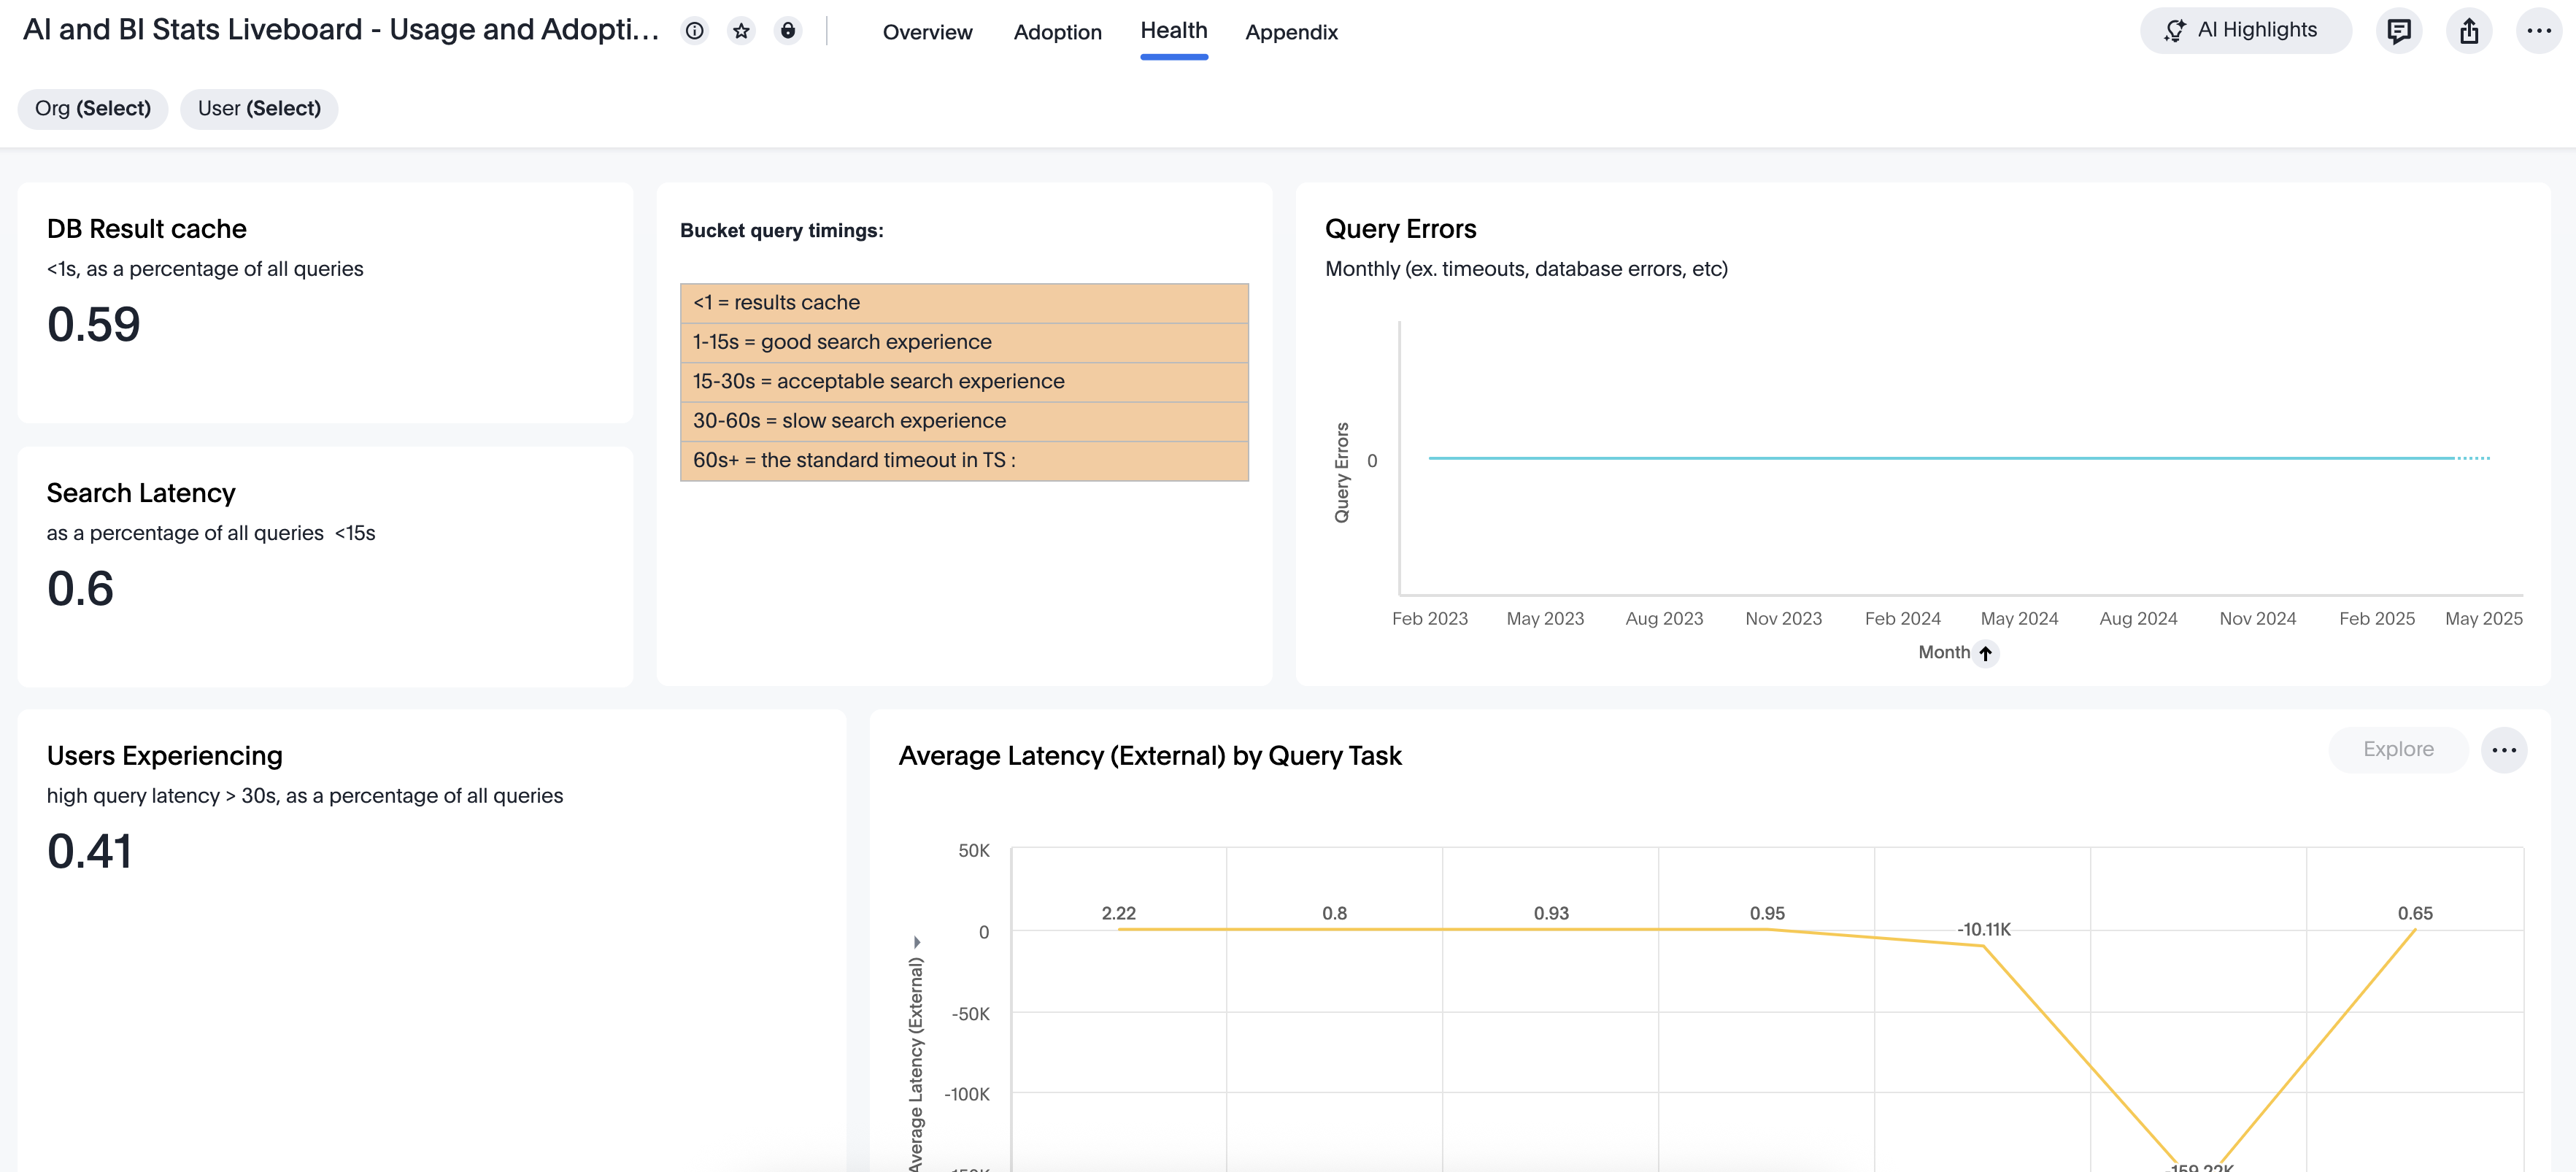
Health
-
a list classifying the query latency (Bucket query timings)
-
the database result cache user is experiencing in ThoughtSpot (DB Result cache)
-
the search latency user is experiencing while executing queries (Search Latency)
-
percentage of user experiencing high query latency (>30s) (Users Experiencing)
-
monthly query errors across the ThoughtSpot application (Query Errors)
-
average latency for various user actions (Average Latency (External) by Query Task)
-
list of 50 slowest queries with query success status, time taken, latency experienced, and the query string (50 Slowest Queries)
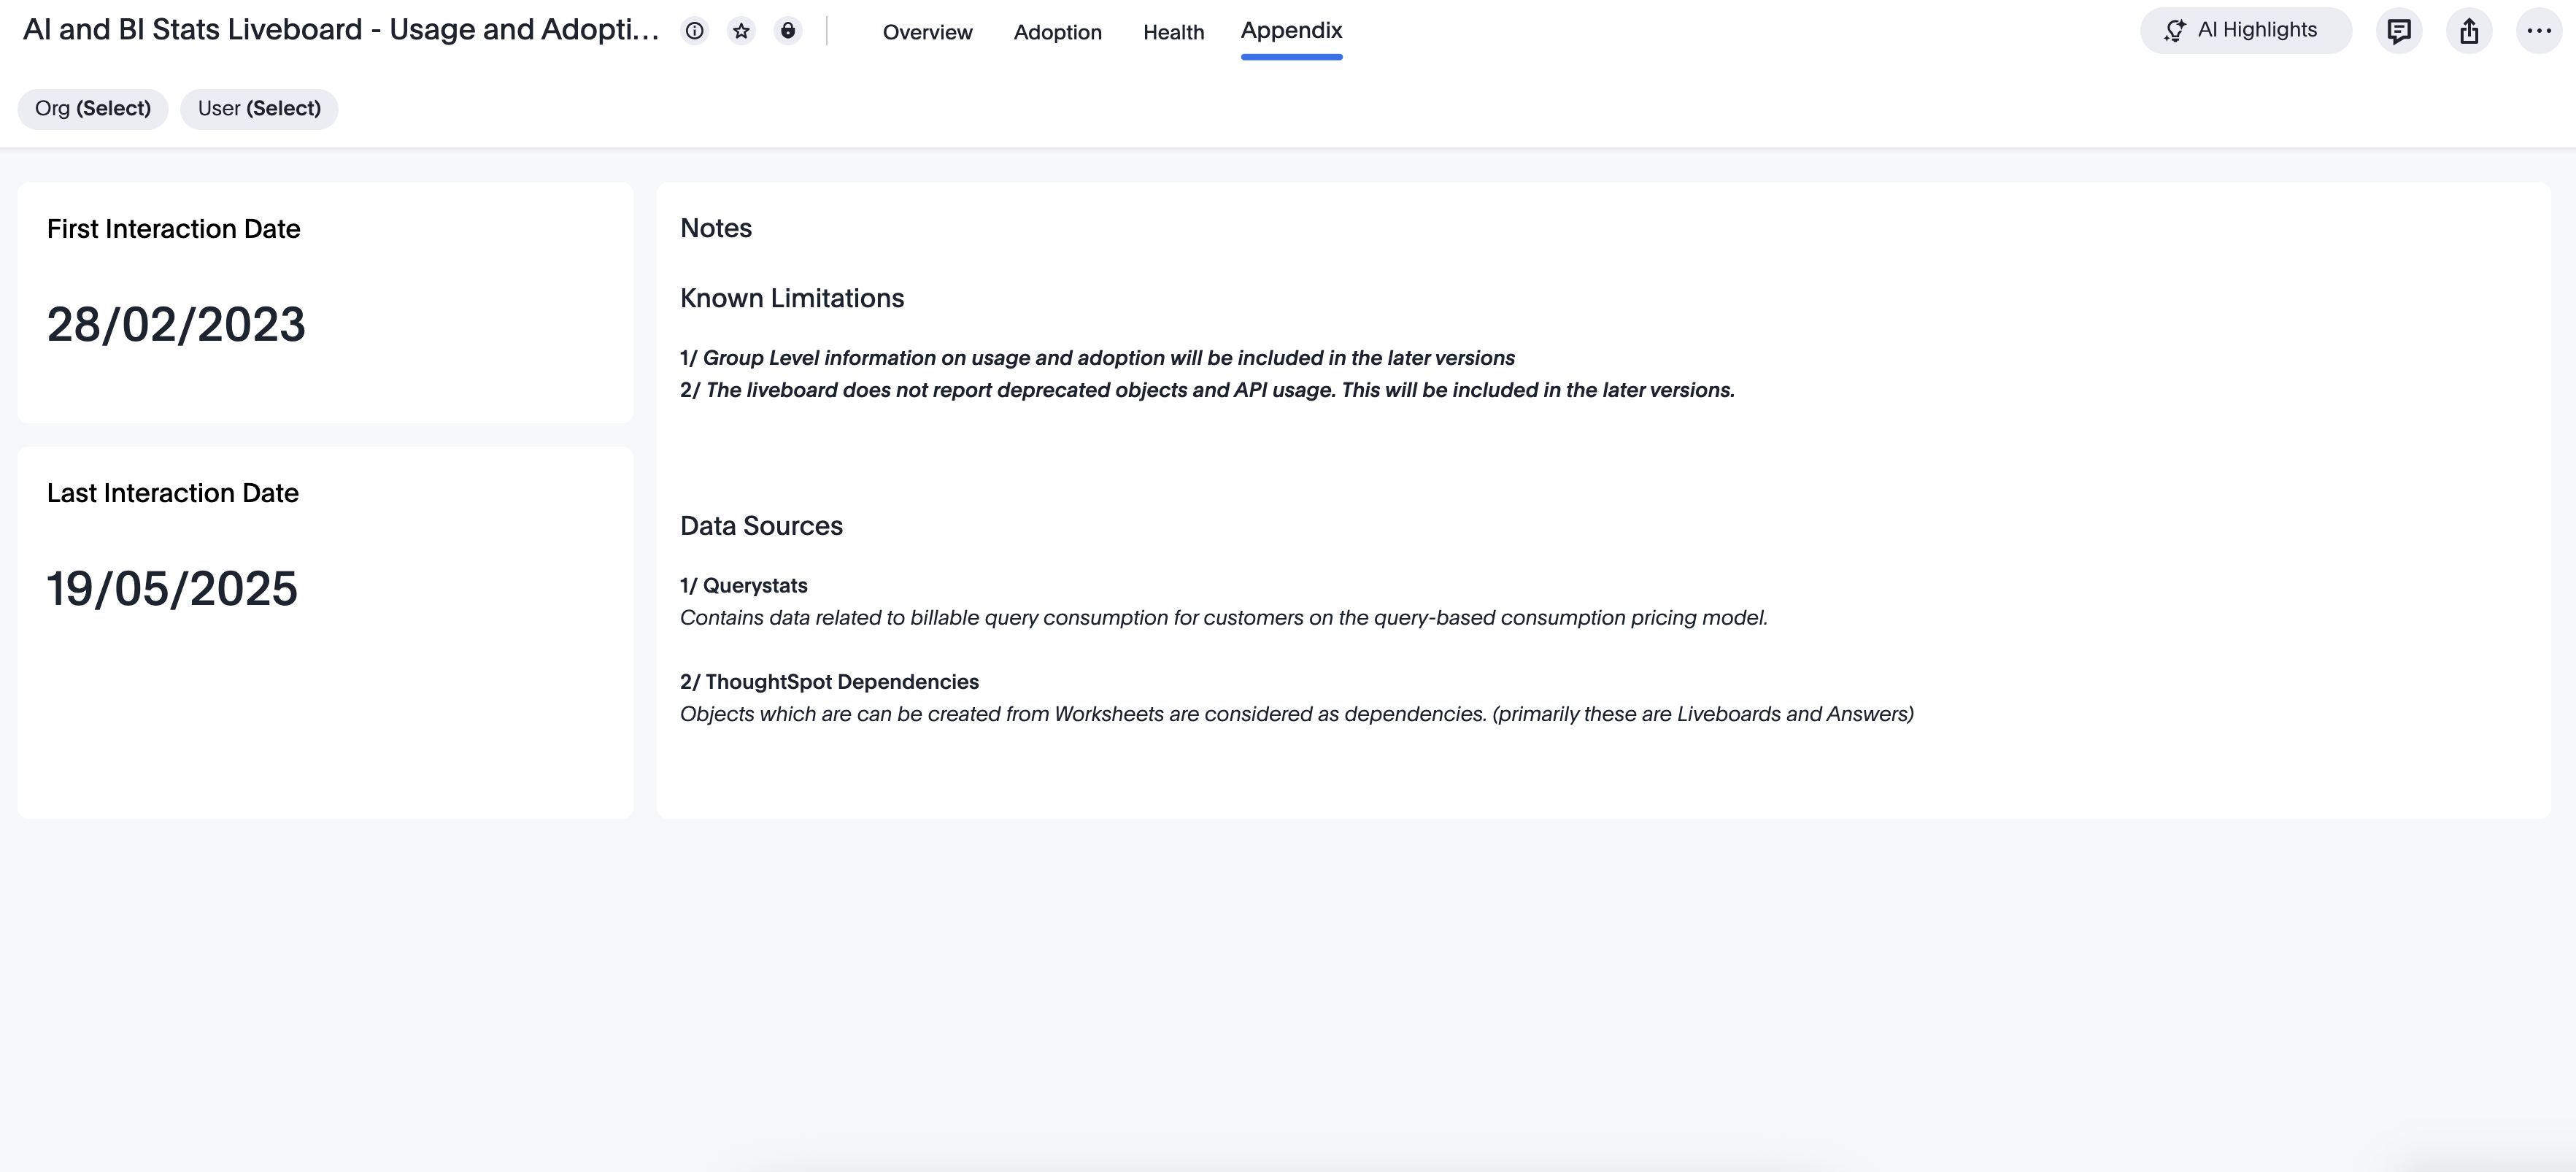
Appendix
-
first interaction date with the AI and BI Stats Liveboard
-
last interaction date with the AI and BI Stats Liveboard
-
the known limitations for the AI and BI Stats Liveboard
-
the list of data sources evaluated to populate the results on the AI and BI Stats Liveboard
Best practices
The AI and BI Stats Liveboard contains valuable information you can use to monitor and manage query consumption by the users. Follow these best practices when interacting with this Liveboard:
-
Share the AI and BI Stats Liveboard with other ThoughtSpot champions and executive buyers in your organization. To share the Liveboard, you must search for the Liveboard from the Liveboards page or from the Home page. You can’t share it from the Admin Console.
-
Consider creating a dedicated group for your data leaders or champions, so you can easily share insights, such as this Liveboard, that help your teams drive adoption.
-
-
Spot query consumption trends, such as the number and types of objects accessed over time
-
Understand Spotter usage and adoption
-
Improve latency time for users across the ThoughtSPot application by analysing the slow performing queries and other health markers